Additional topics and tutorials#
Making final image figures#
After image processing (e.g. image reconstruction, cropping, rotation, adjusting brightness contrast) the actual figure that will be published needs to be created. For creating correct and informative image figures the images need to be properly sized as well as annotated. In this section we would like to explain these tasks, common pitfalls and provide different receipts to solve them.
Raster graphics#
In order to understand many of the issues we will discuss below we need to first understand the concept of raster graphics. Any digital image, including a microscopy image, is a raster graphic and thus a grid of pixels (i.e. raster). A raster image has a discrete number of pixels in width and height and each pixel has a specific intensity value (bits) (Figure 1).
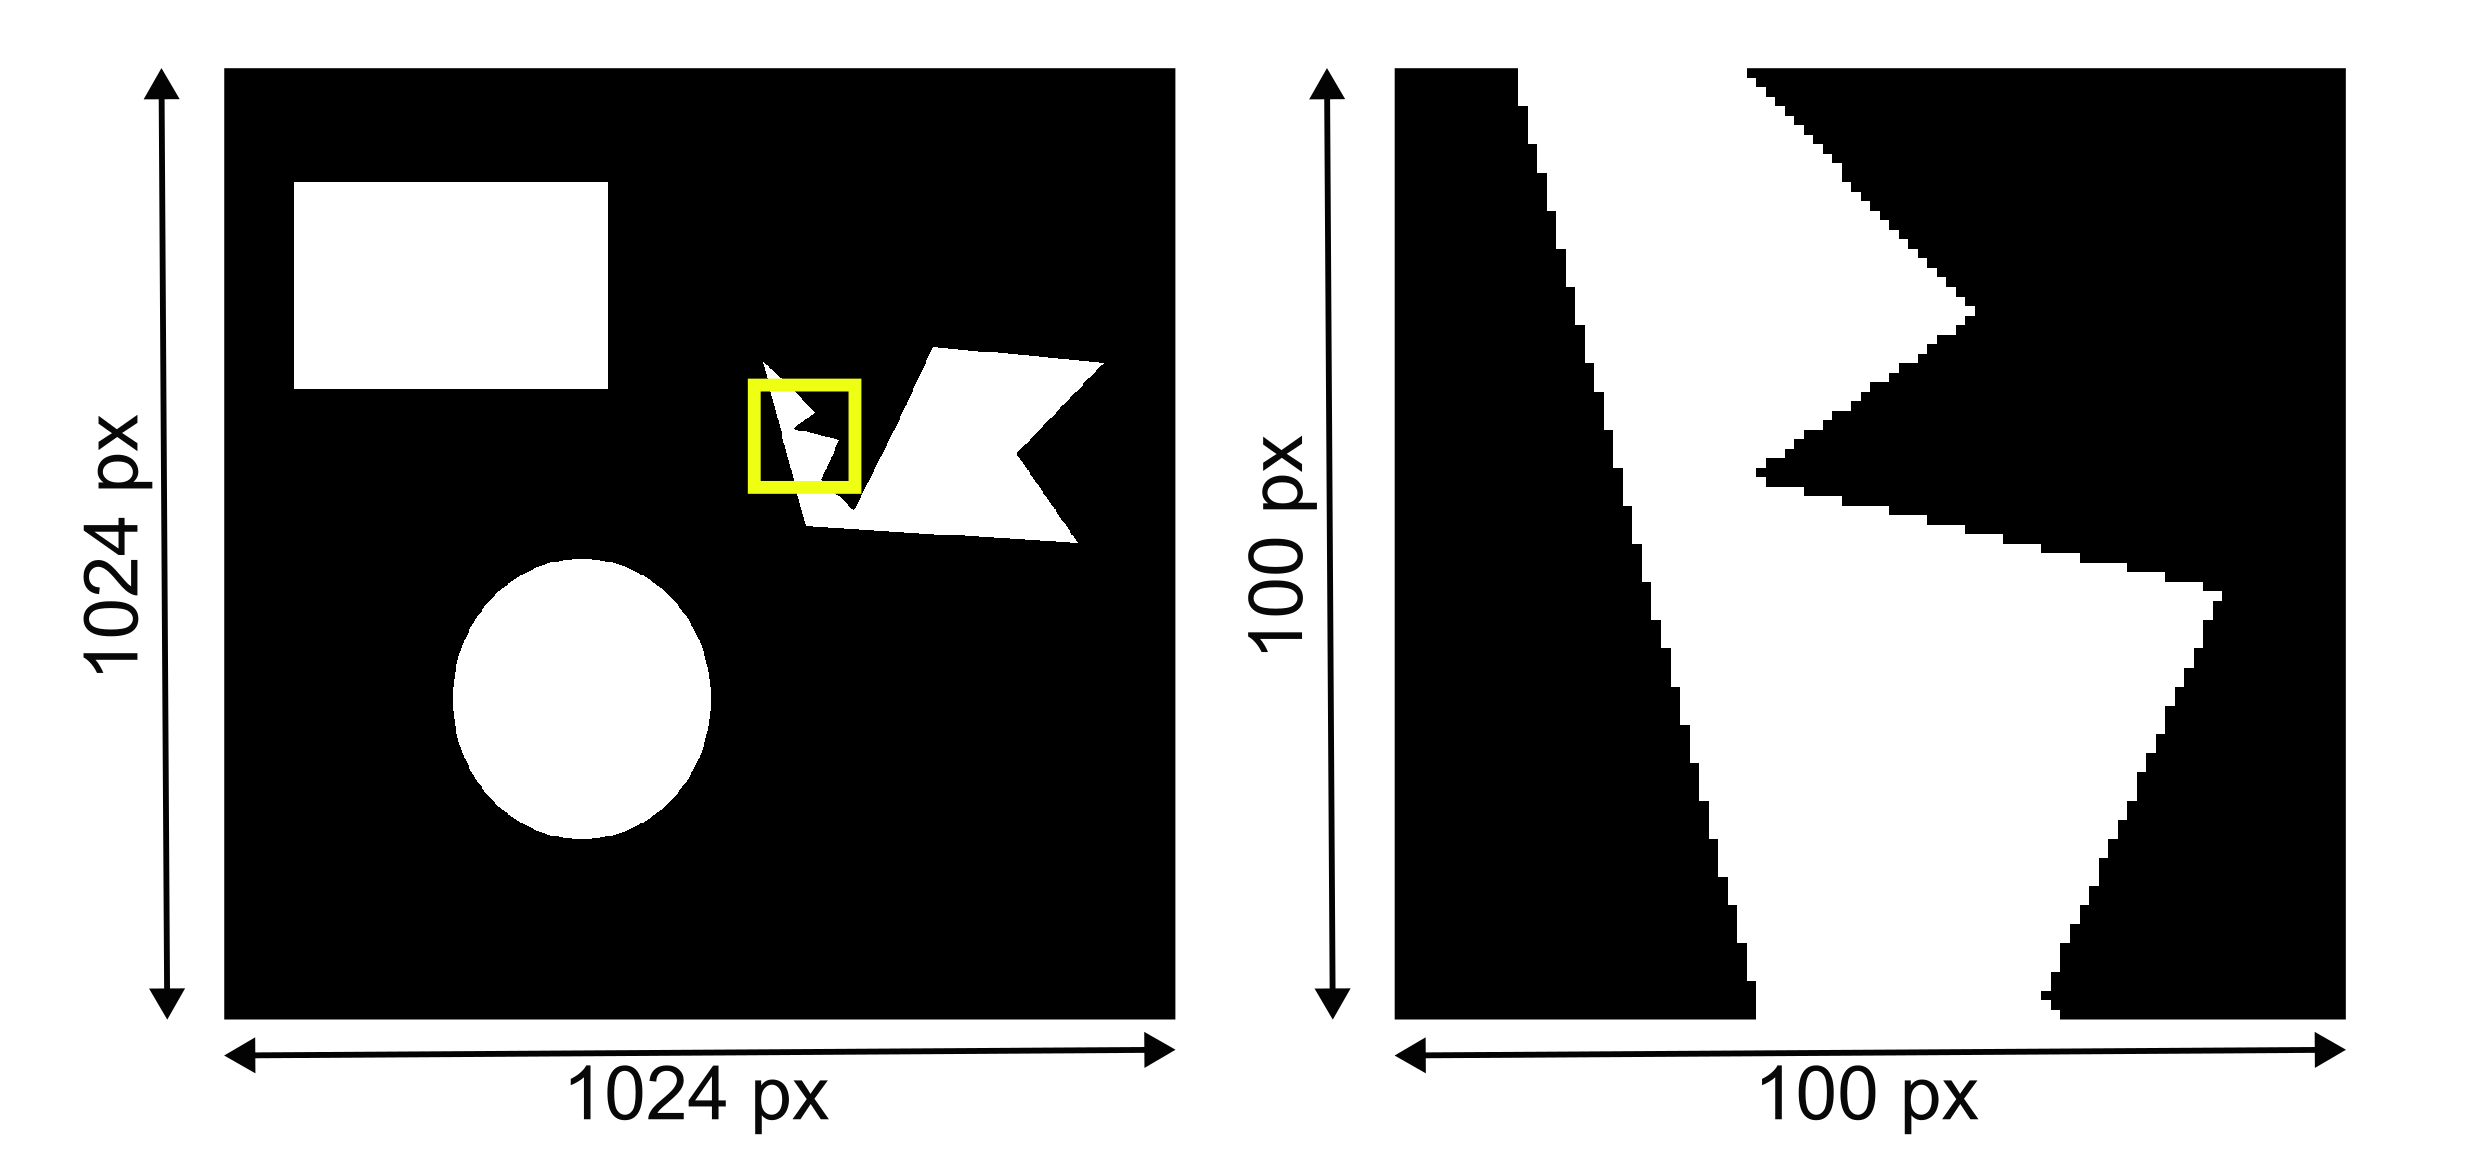
Fig. 1 Figure 1: (A) Example raster image with 1024 pixels x 1024 pixels and 8-bit depth. (B) A 100 pixels x 100 pixels crop (A, yellow outline) reveals the discrete nature of a raster image. Continuous objects are discretized into individual pixels in space.#
Typical image processing and analysis software are performing mathematical operations on this grid of pixels and thus are raster graphics software. Important for scientific images to understand is that each pixel in the image corresponds to an actual scientific measurement in a defined space on the imaged object. Thus, any computation on these values need to be performed with care to not alter this information improperly.
Image figures and printing resolution#
For publishing we need to be able to create a document that can be printed on physical paper. In order for any information to be readable on such a document it needs to be printed in a sufficient enough resolution. This is typically defined by journals at a minimal resolution of 300 dots per inch (dpi). This corresponds to the density of printed dots on the journal paper and it applies to the whole figure, including each individual image.
A4 page at 300 dpi#
For an A4 page this would translate by convention into 2480 x 3508 pixels for the entire page to reach this 300 dpi resolution condition:
Physical dimension of A4 page (Width x Height): 210 mm x 297 mm or 8.27 inches x 11.69 inches
8.27 inch x 300 dpi = 2481 11.69 x 300 dpi = 3507
An A4 page of 2480 x 3508 pixels corresponds to a printing resolution of 300 dpi (Figure 2).
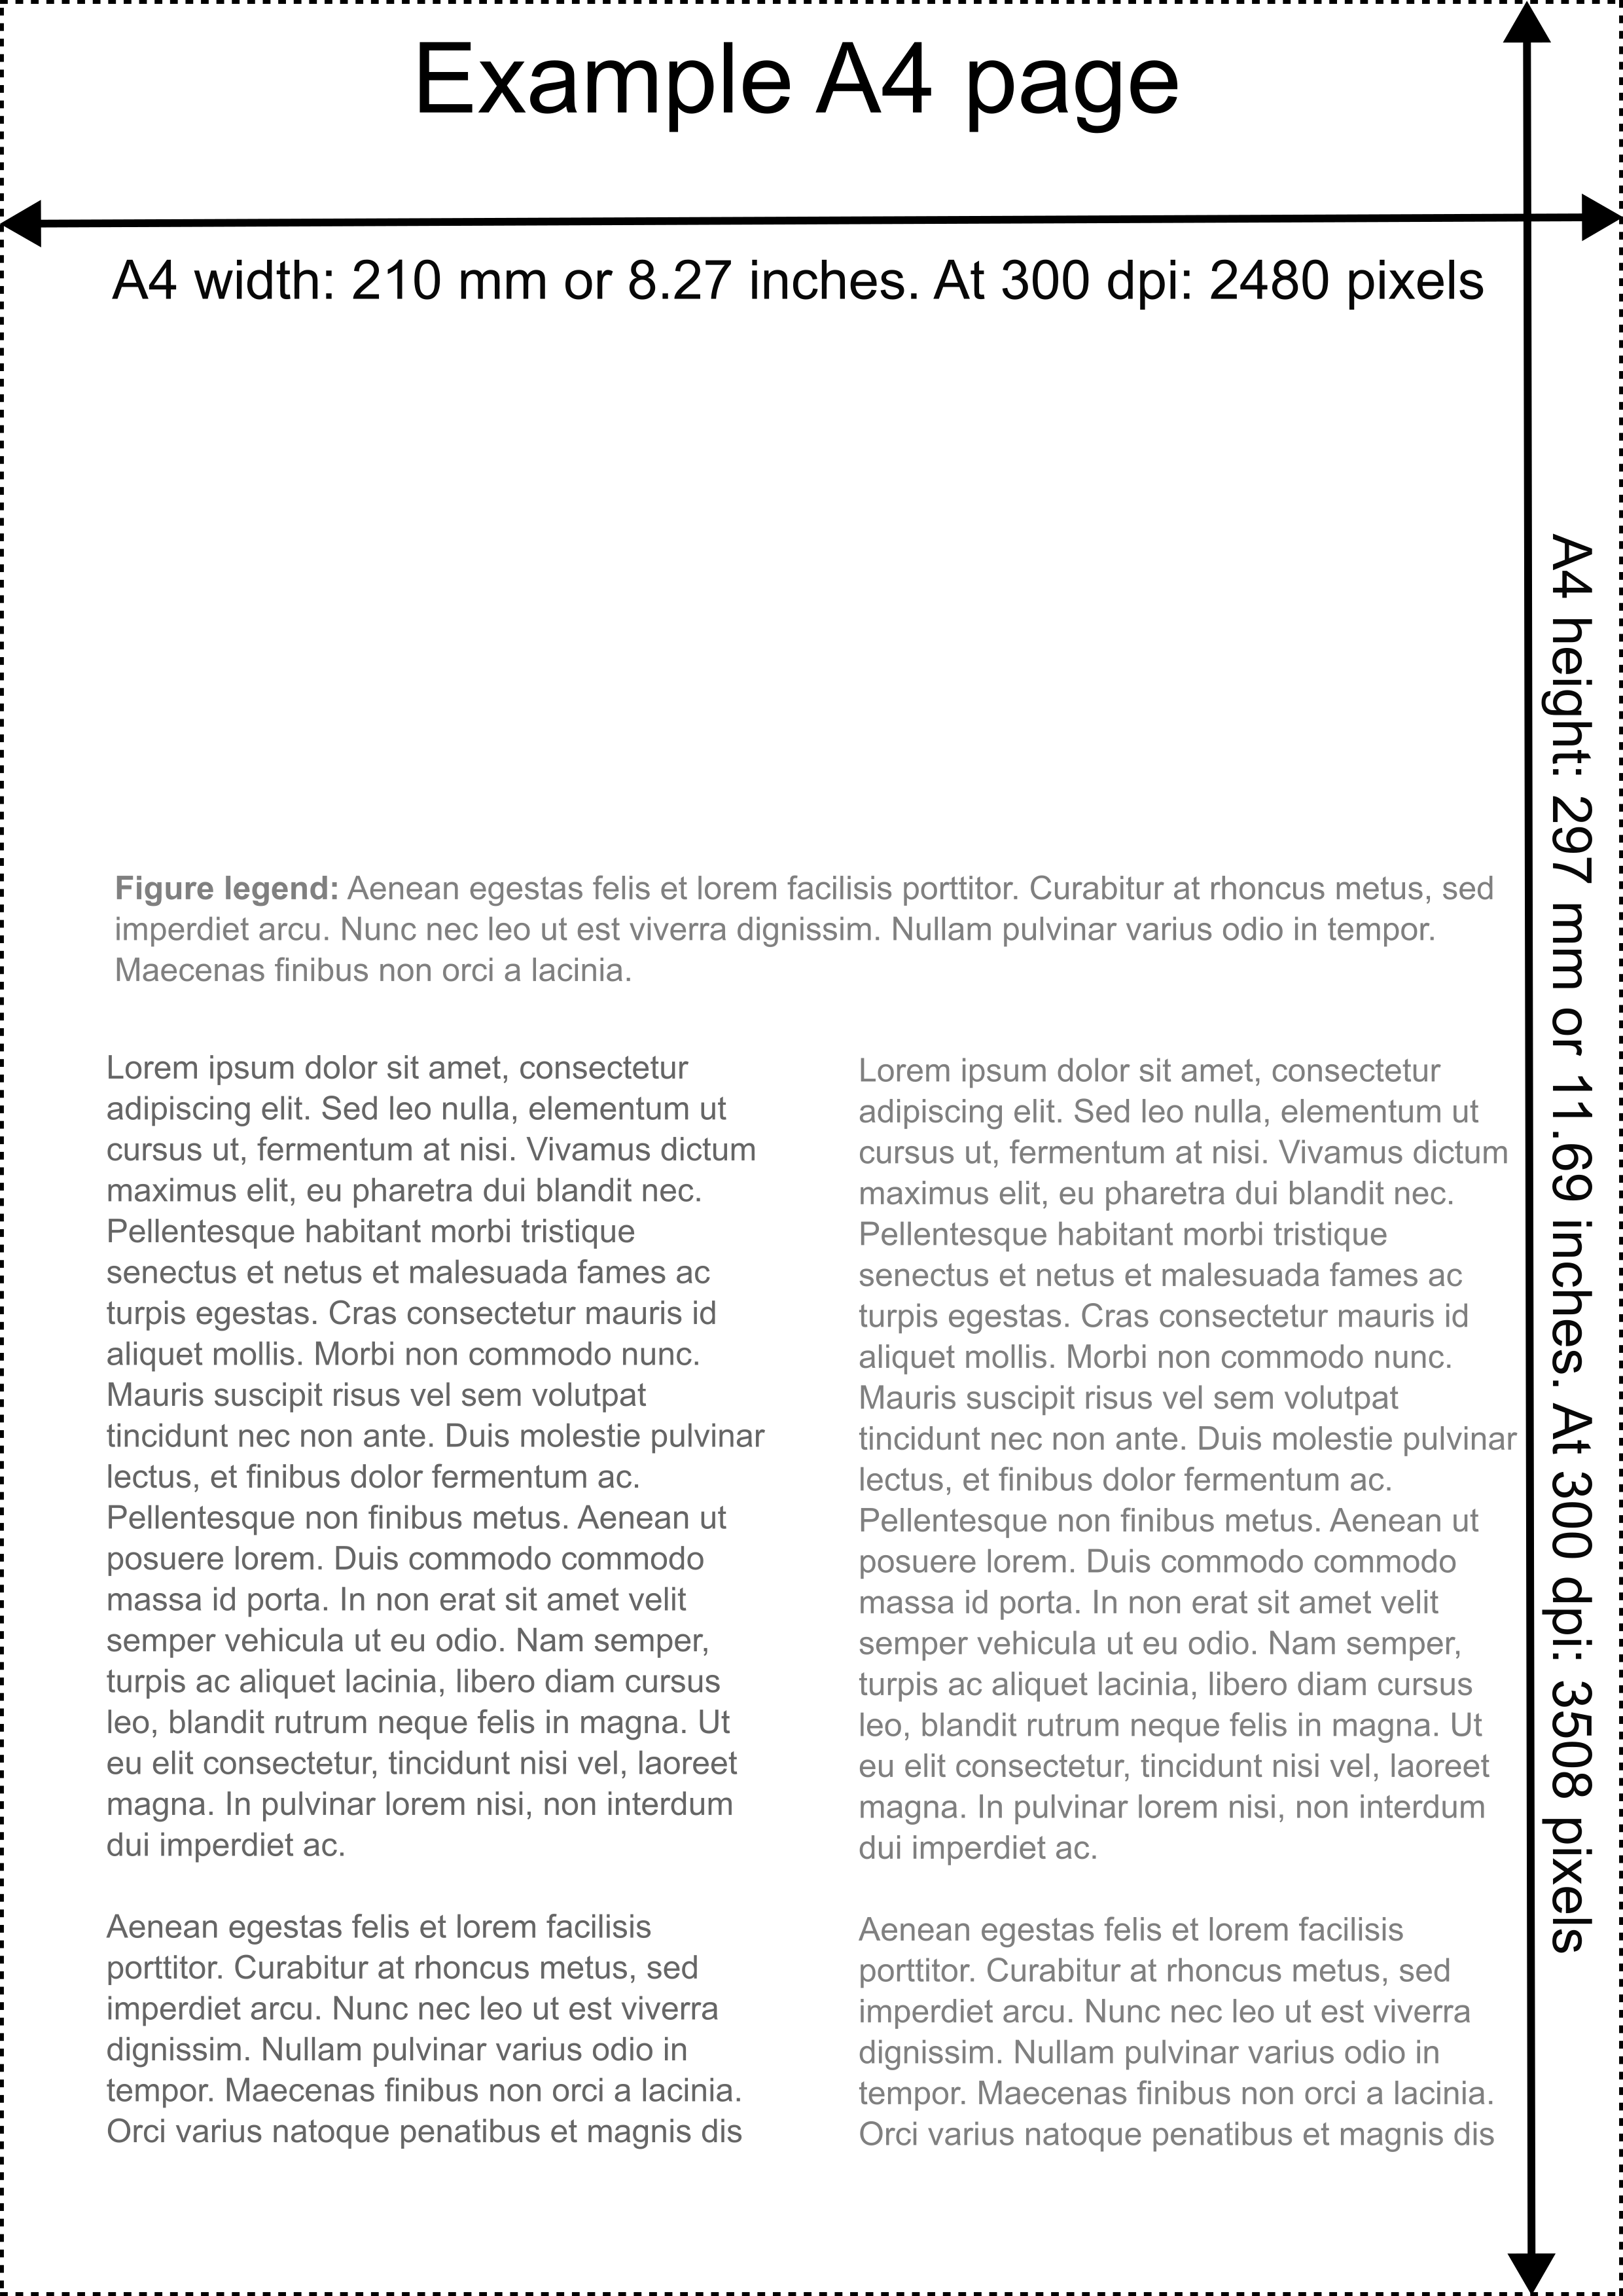
Fig. 2 Figure 2: Mock A4 journal page at 300 dpi printing resolution. This translates to a dimension of 2480 and 3508 pixels.#
Images on page with 300 dpi#
We need to place our example images on this page to show the result. If we now would directly translate the pixel dimension of the example image into the printing resolution the image would have a dimension of 87 mm x 87 mm on this A4 page:
1024 / 300 dpi = 3.14 inch = 87 mm
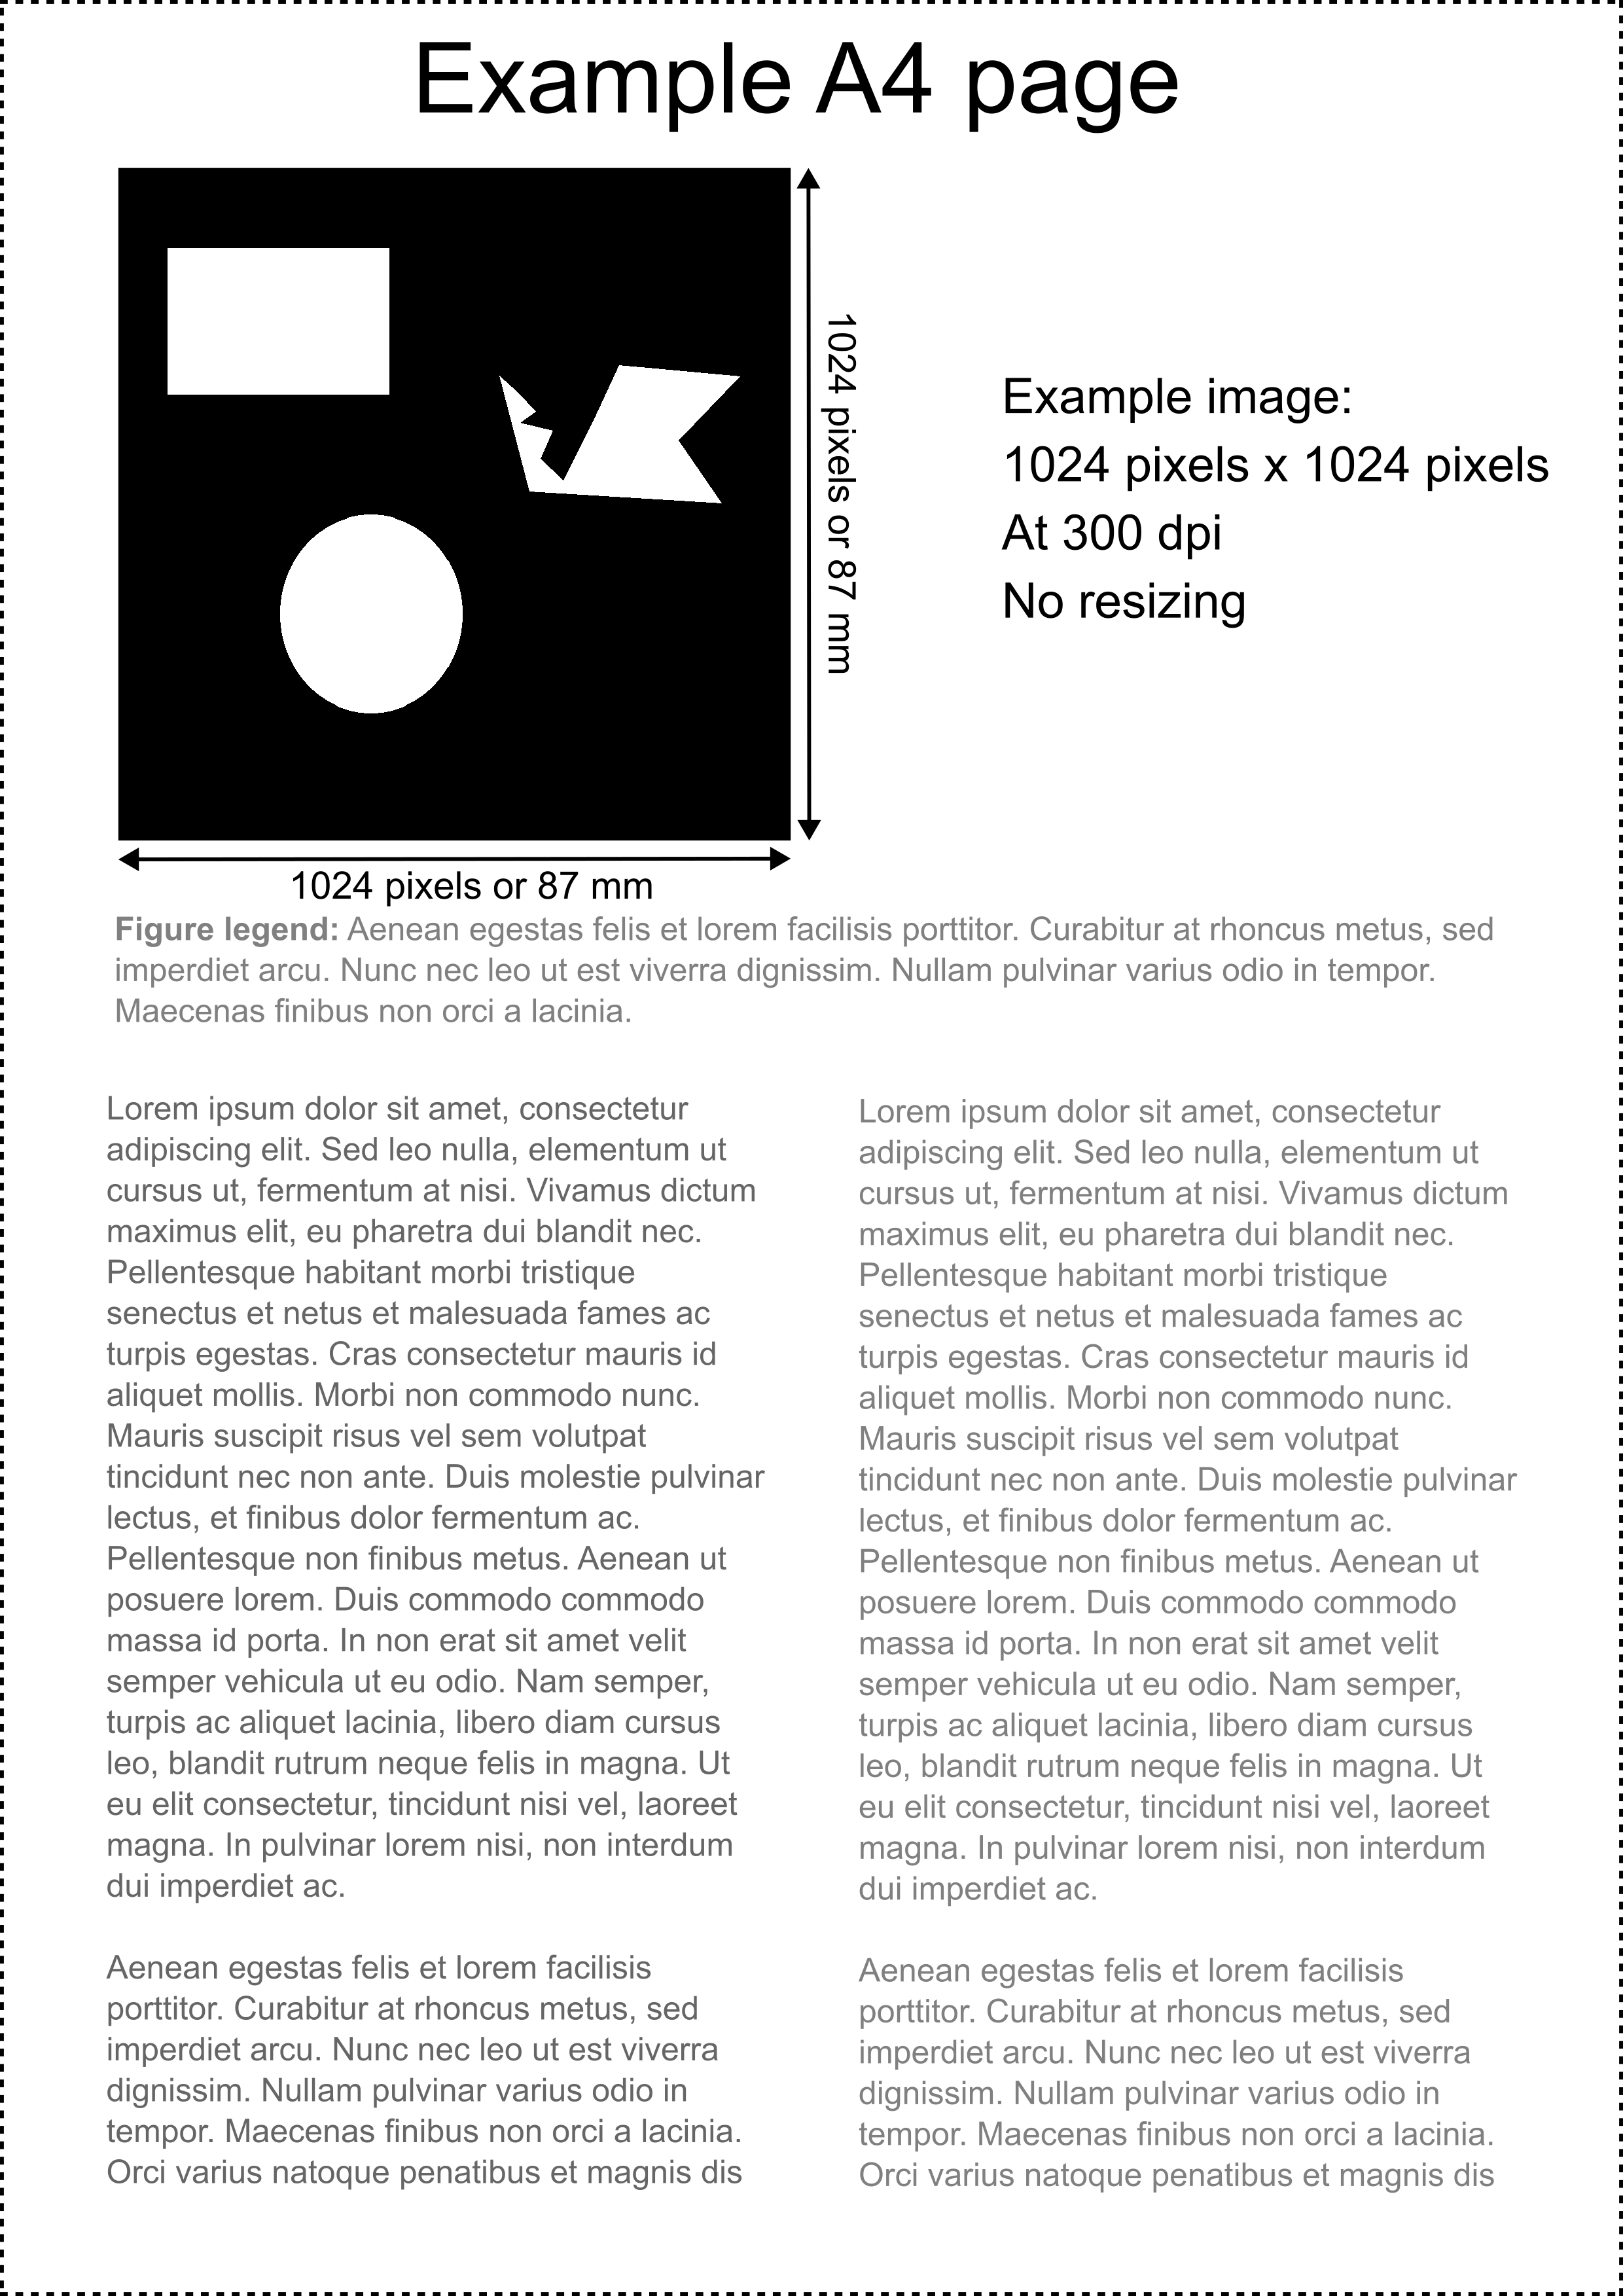
Fig. 3 Figure 3: Mock A4 journal page with example image at 300 dpi without resizing and each pixel of the example image corresponding directly to the required printing resolution.#
Thus our image would have a printed size of 87 mm x 87 mm. This would be a pretty large panel in our final figure. Typically one would like to show also other information (e.g. images, graphs). Thus, the image needs to be resized (Figure 3).
Resizing an image using raster image processing software means in simple terms that the number of pixels in the image needs to change. Thus, for enlarging an image the pixel number needs to increase and if the image is reduced the number of pixels is reduced. This operation in raster graphics is done using interpolation algorithms.
Resizing for scientific images#
This poses a problem for scientific images. As we introduced above each pixel in a scientific image corresponds to a specific measurement in space (sample) that has been acquired using a microscope. Ideally we don’t want to alter this information at all. However using different methods for resizing images can have dramatically different effects on the data (Figure 4).
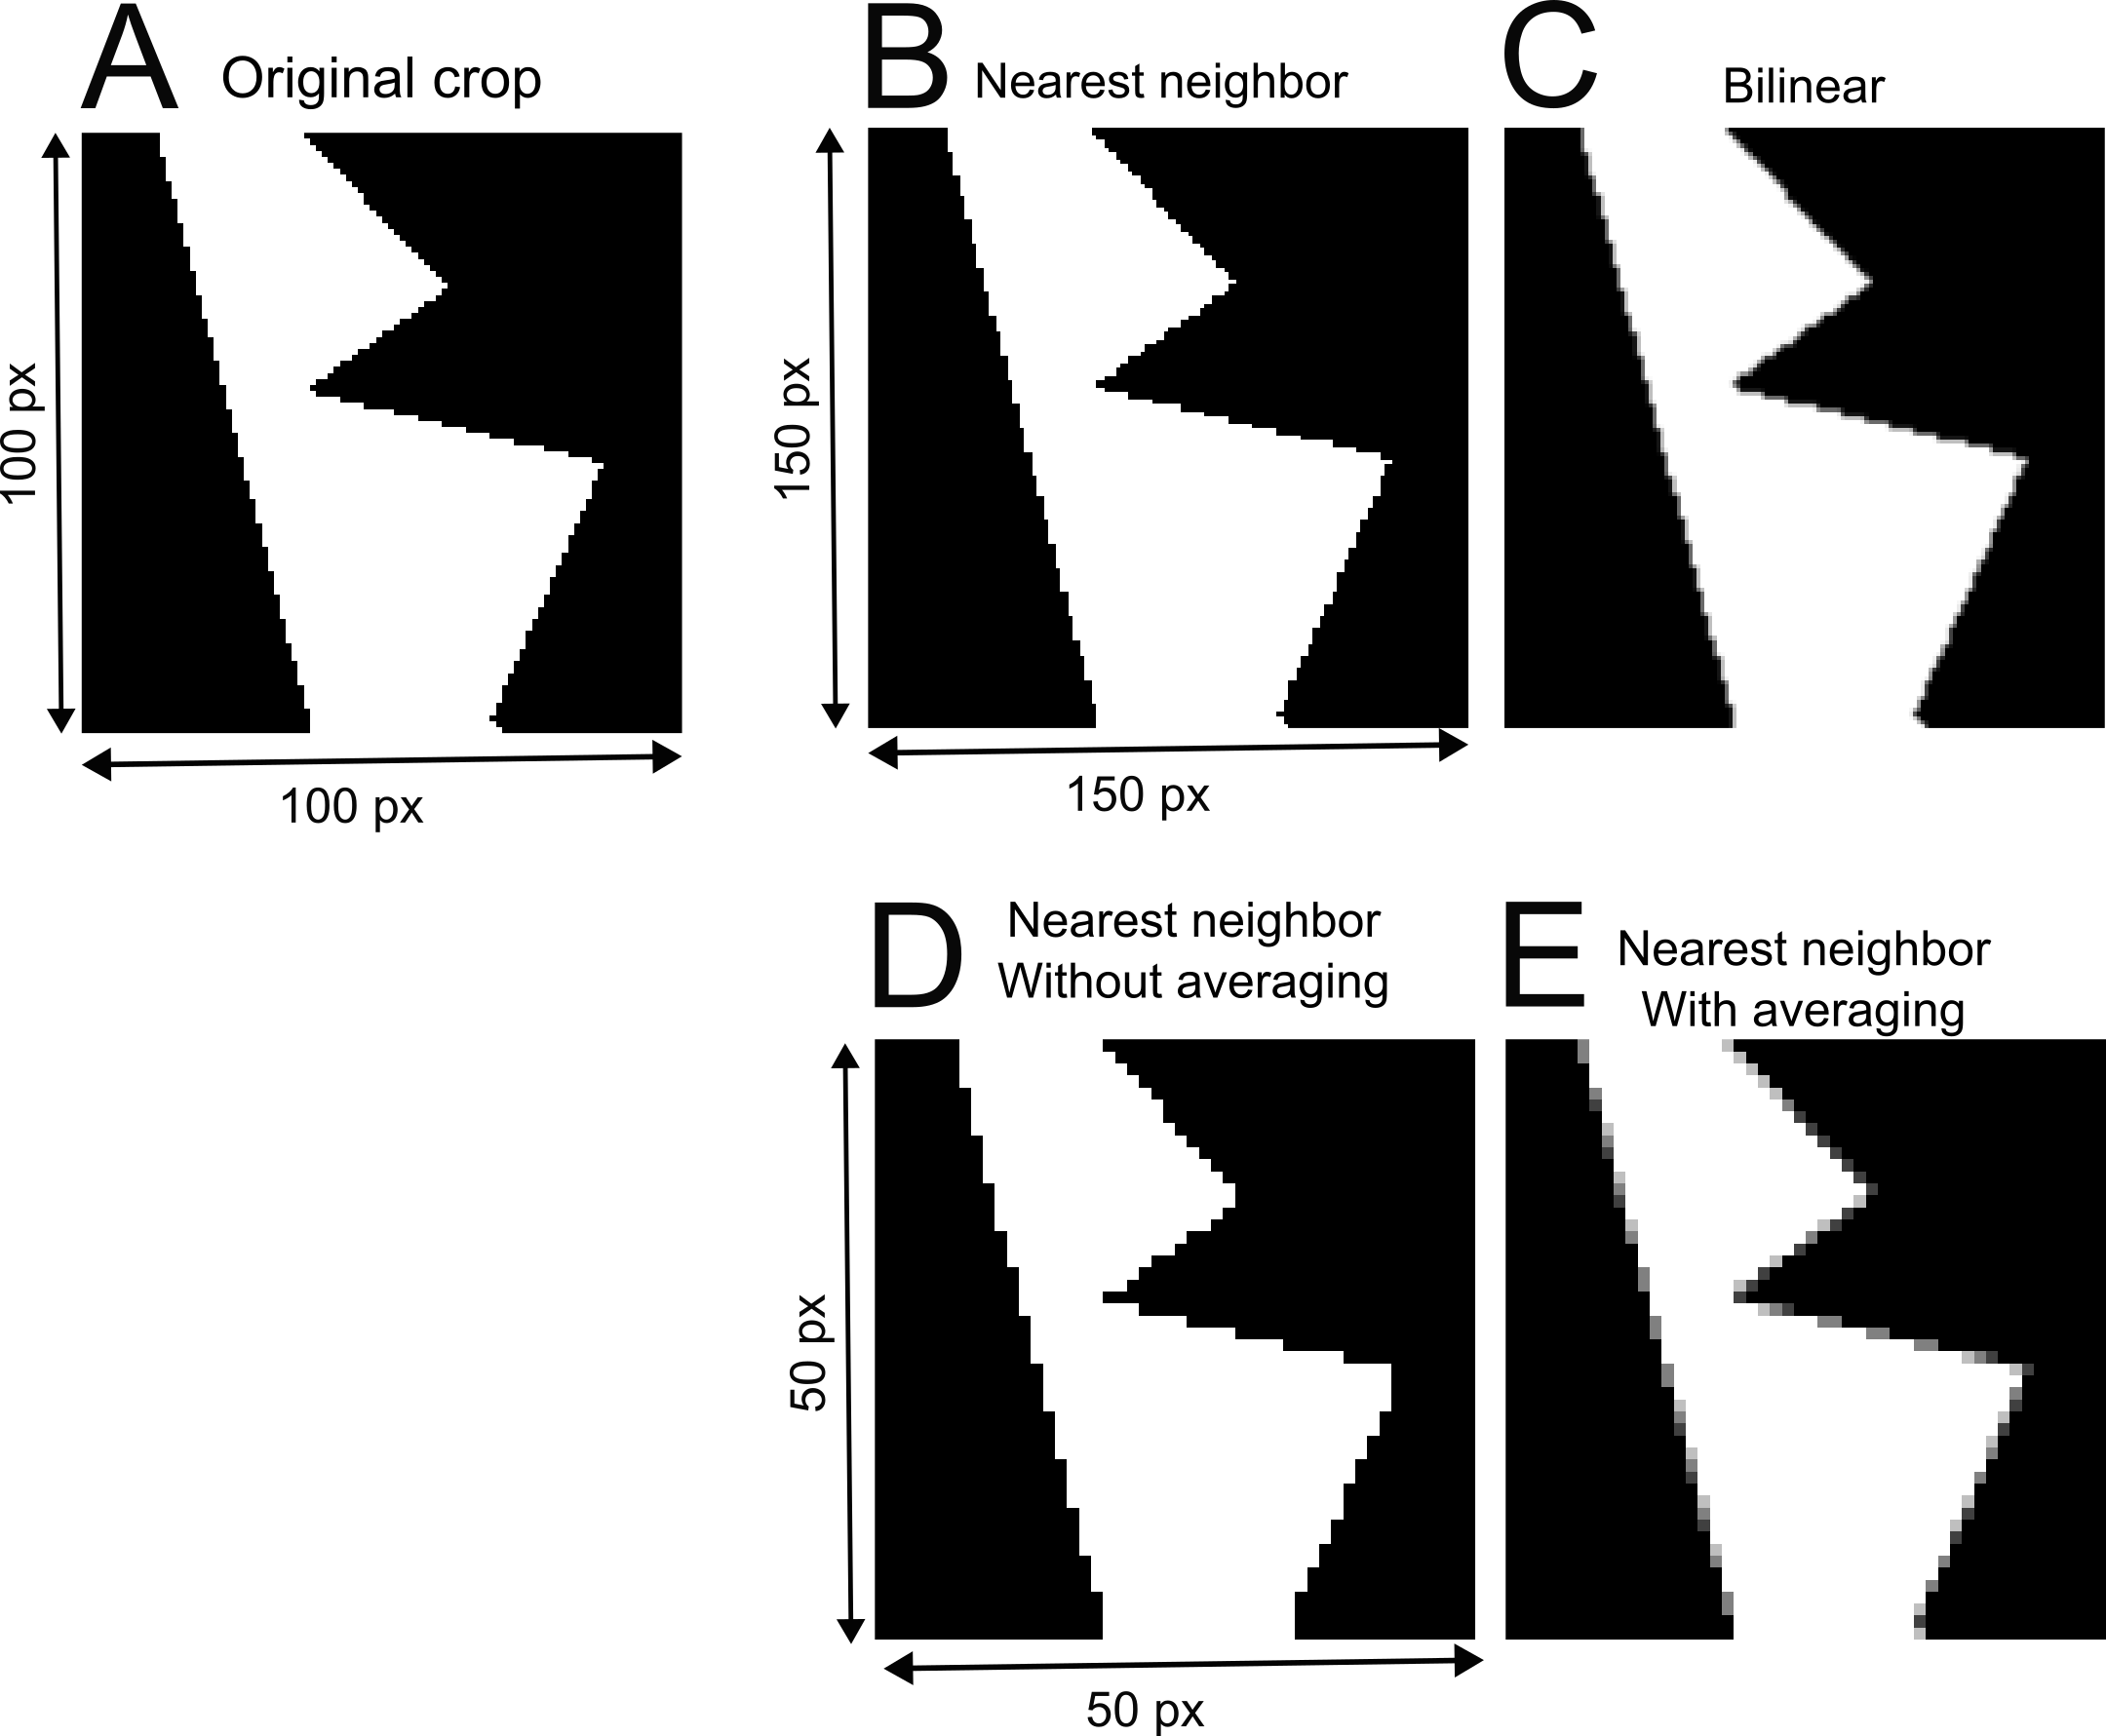
Fig. 4 Figure 4: (A) Original crop from example image (see Figure 1). (B-E) The crop is resized with different interpolation methods. (B) The example image crop is increased in size by 50% using the nearest neighbor interpolation. (C) The example image crop is upsampled using the bilinear interpolation. (D) Downsampling using nearest neighbor interpolation without averaging (E) Downsampling of the example image crop with nearest neighbor interpolation with averaging.#
Depending on which algorithm is used the individual pixel values are altered in different ways. In this example different resizing methods using Fiji Image > Adjust > Size… is performed. While we will not go into detail on all methods, it is important to understand that the size change of a raster image using raster graphics software needs to use some form of computation and depending on what precise operation is carried out can alter the pixel values.
Vector graphics#
One method to overcome these hurdles is the use of vector graphics and vector graphics programs (e.g. Inkscape, Adobe Illustrator). Vector graphics work differently from raster graphics in that images are not created by pixels but from mathematical shapes such as points, lines, curves and polygons. This means that objects which are represented in vector graphics can be scaled without interpolation. Some journals are now requiring scale bars, for example, to be added as vector graphics. link.
Image annotation#
When designing a figure further modifications such as annotations need to be made. Objects such as arrows and scale bars need to be added.
Image processing and analysis platforms can add annotations as a separate layer that can be toggled on and off. However in order to use annotations generated by such raster graphics programs in presentations and image figures these annotations the image needs to be flattened and the annotations are burned into the image. Depending on the size of the annotation and the available pixel resolution of the image the annotations then can also be dramatically degraded.
Alternatively many of these annotations can also be applied in the vector graphics program.
General recommendations for creating final image figures:#
Any modification must be applied to a copy of the image, and the original must be kept intact.
What the image intends to show should be clearly visible.
The resizing must not alter the interpretation of the image.
The proportion of the image must be preserved.
The modified image should only be used for display in the article, not for image analysis.
Annotations need to be clearly visible and not obstruct or obscure important information in the image