Image format#
Light microscopy images in publications can rapidly communicate useful details if they are prepared to be information dense, clean and containing the most important information/metadata the audience needs to see at a glance. A set of simple processing rules can focus the audience’s attention to the most relevant parts that are crucial for understanding the experiment and/or results. Consult the steps below to start your journey to create understandable and reproducible figures.
Minimal
 Focus on relevant content
Crop empty/irrelevant portions of the image to focus the audience’s attention. Rotate images when required, ideally in 90 degree increments, but make sure to use bilinear or bicubic interpolation otherwise. Resize images to fit the intended panel size, always making sure to constrain the aspect ratio.
 Separate individual images
There should always be some sort of border with a strong contrast to indicate a difference between images, whether this is the same color as the page background for individual images in a panel, or a color not otherwise found in the image for a magnified inset.
 Show example image used for quantifications
Provide context and a dash of accountability by complementing a graph of results with at least one of the quantified images. Those example images should be unchanged to show the original data that were used for quantification. It maximally should include a quantitative background subtraction by subtracting a measured imaging background value if significantly high to reduce any negative impact on intensity readout.
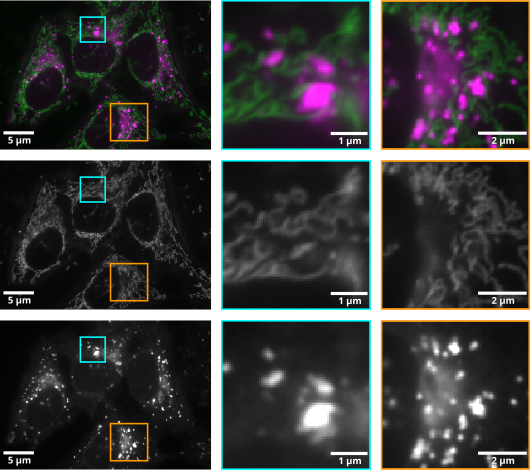
 Indicate position of zoom-view/inset in full-view/original image
When presenting two magnification views of the same image (e.g., a full and a zoomed or inset view), the position of the inset within the full-view image should be indicated as exactly as possible. If the inset is placed on top of the full-view image, for example to save space, it should not obstruct any key data, and if resized, it should not be interpolated in a way that gives the impression of higher resolution than was actually obtained.
 Show images of the range of described phenotype
As tempting as it may be to cherry pick the image that shows the nicest or most representative case, show the audience a flavor of everything: the good, the bad and the ugly. Be sure to clearly indicate which population each image is selected from.