Introduction to tutorials#
This tutorial shows in practice how to create an image figure for publication using Fiji and Inkscape. The intention is to take one example from the original image and create a complete image figure, including the figure legend and methods used to create and process the images.
The result should be an image figure that truthfully and effectively reports the scientific result that the figure represents:
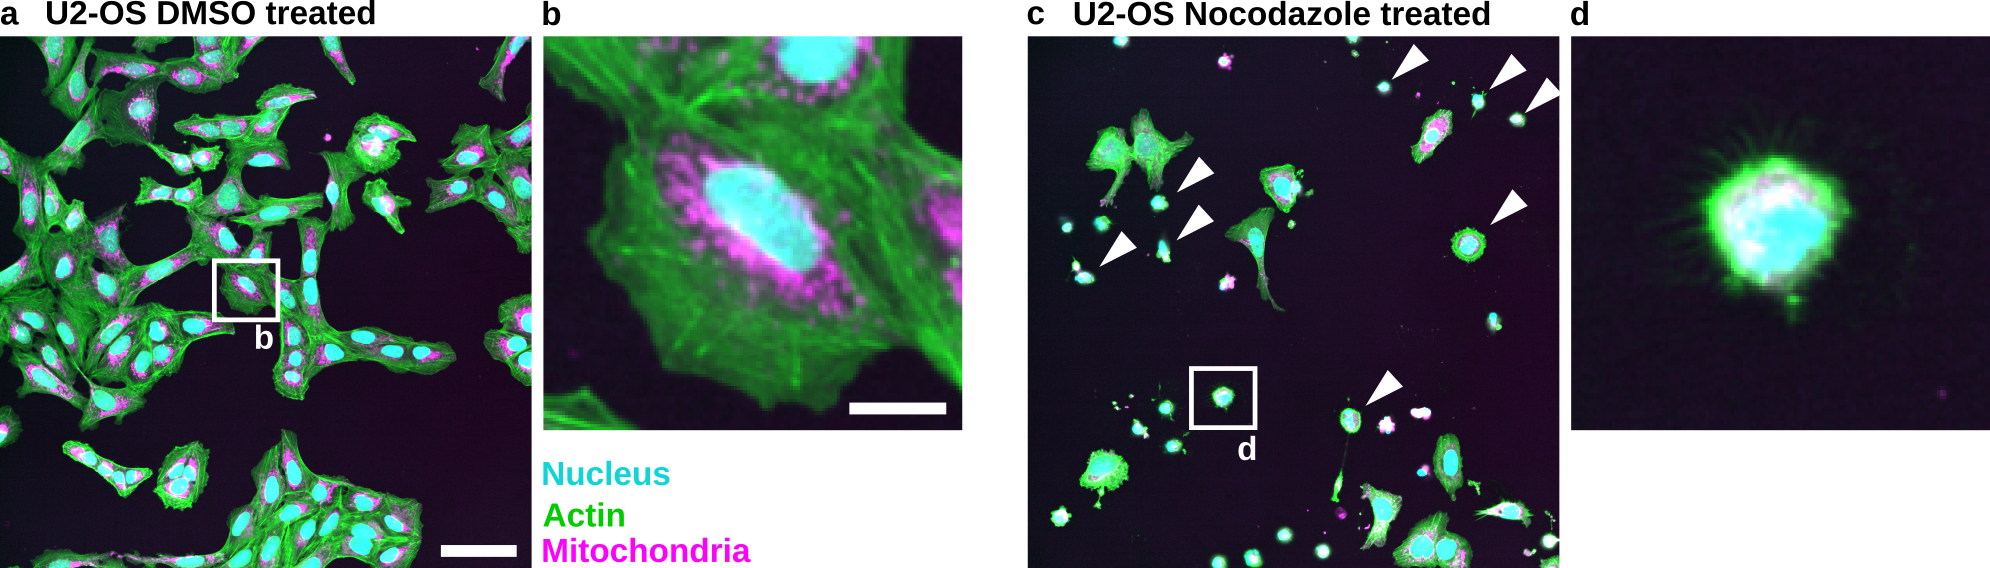
Fig. 1 Nocodazole induces cell death in U2-OS cells: (a) U2-OS cells treated with DMSO only. (b) Cropped image of a single cell treated with DMSO. (c) U2-OS cells treated with Nocodazole at a 5 µM concentration show increased cell death. Note the many small round cells (White Arrowheads). (d) Cropped image of a dead or dying cell. Scale bar represents 100 µm (a) and 20 µm (b).#
Materials#
For this tutorial you are going to need:
Fiji is just ImageJ (Fiji): https://fiji.sc/
Inkscape: https://inkscape.org/
Image data: Zenodo repository
Note
We selected these tools because they are free, open source, and familiar to the authors. The underlying principles, however, can be applied to other tools.
Checklist#
To help guide authors to create good image figures we have created a set of Checklists. This tutorial is based on a condensed version of the checklist (see Condensed checklists.).
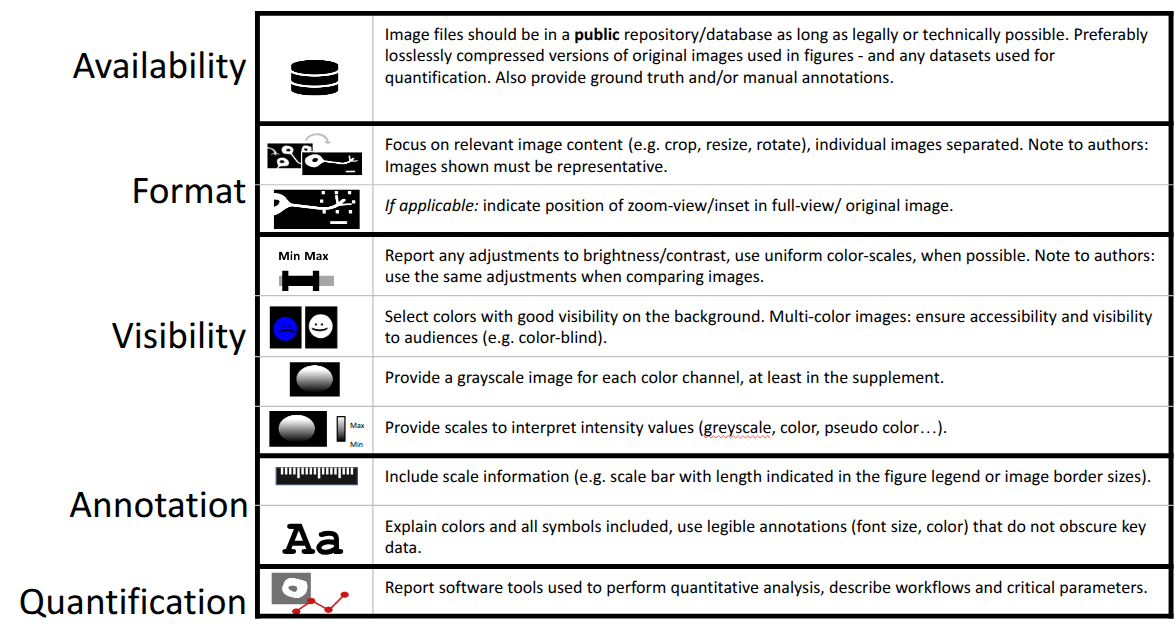
Fig. 2 Condensed checklists.#
Table of contents#
Further material#
Cheatsheets for creating image figures:
Schmied C. and Jambor HK. Effective image visualization for publications – a workflow using open access tools and concepts [version 2]. F1000Research 2021, 9:1373 (doi: 10.12688/f1000research.27140.2)
Images for the examples were published here:
Wolff C. et al. Morphological profiling data resource enables prediction of chemical compound properties. iScience 2025 (doi: 10.1016/j.isci.2025.112445)
Help#
If you need help write to the team on image.sc: https://forum.image.sc/tag/quarep.
You can also reach out to the creator of this tutorial: schmiedc